It continues to be worth poking around data.act.gov.au to see what trends are happening on Canberra public transport.
Weekday boardings have plateaued at around 85% of pre-pandemic numbers
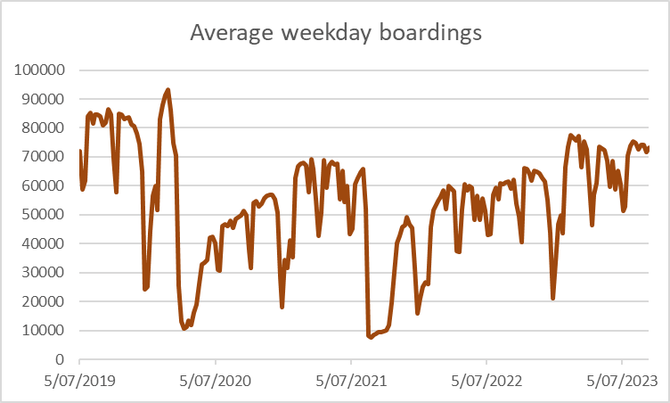
We’ve been monitoring how the pandemic affected public transport patronage for some time now. From these 2 charts you can see:
- pre-pandemic, weekday boardings averaged around 85,000
- even once things opened up in 2022, people were pretty reluctant to use public transport, with average weekday boardings around 60,000 – 65,000
- things improved a bit this year, and we’re now averaging around 75,000 boardings each weekday, or around 88% of pre-pandemic usage
- if you look more closely at 2023, you can see there’s been no growth: weekday PT usage peaked in March. Hopefully the improvements to the Term 4 timetable entice a few more people back onto the buses.

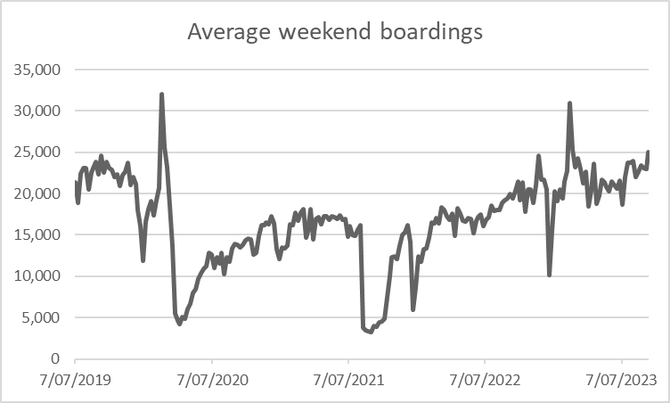
Weekend bus usage is back to pre-pandemic numbers
It’s a different story on weekends. You can see a steady trend of increasing patronage over 2022-23, with the most recent weekend of 16-17 September 2023 averaging over 25,000 boardings, on par with pre-pandemic figures. Just think what it will be like when we get hourly weekend service back!
Those two spikes of over 30,000? That’s the National Multicultural Festival, which leads us to the next trend…
Major events get new users onto light rail
The light rail data also has a breakdown between MyWay and paper tickets (ie from the vending machines on the platforms). You can see a spike in paper ticket sales on days of major events, presumably because they attract passengers who don’t have a MyWay card.

Punctuality is stubbornly low
Only 75% of Transport Canberra bus services run on time, with “on time” defined as arriving at a timing point between 1 minute early and 4 minutes late of the scheduled time. Roughly 15% of buses run late, and 10% run early.
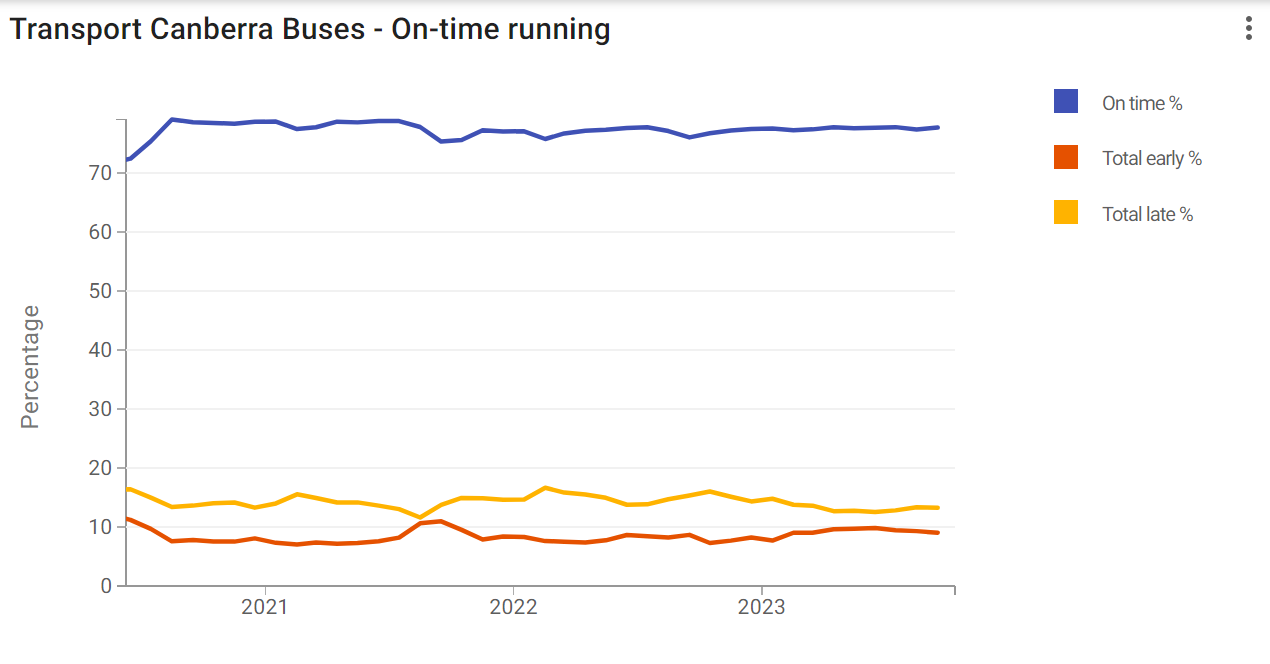
This is out of line with other states, which appear to have better figures. But we’re still investigating whether this is due to differences in how we collect our data, or just poorer performance.
